Physical Geology Slides-Geologic Maps
Steven Dutch, Natural and Applied Sciences, University of Wisconsin - Green Bay
First - time Visitors: Please visit Site Map and
Disclaimer. Use "Back" to return here.
Topographic Maps
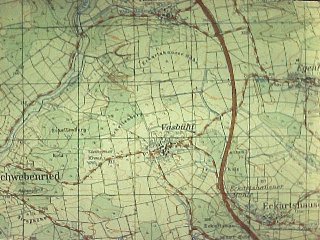 |
Topographic maps show landforms and cultural features.
This is a portion of a map of Germany. The grid squares
are one kilometer on a side. Note the extremely high
density of human cultural features. |
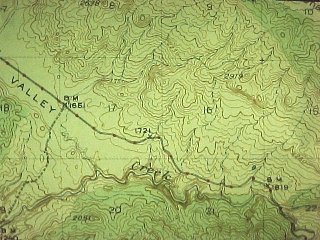 |
A portion of a US topographic map (California). The
grid squares are a mile on a side. Note the much lower
density of cultural features. |
Bench Marks
|
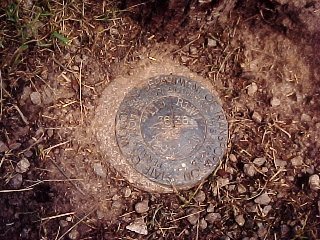
Bench marks are the skeleton on which maps are
supported. They are extremely accurately surveyed points
to which the location of everything else on a map is
related. This bench mark, on the Wisconsin-Illinois
border, is the starting point for the entire survey grid
of Wisconsin. |
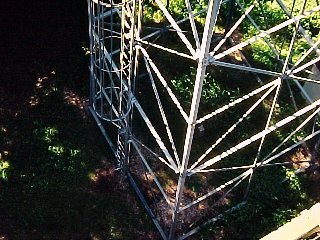 |
Timms Hill, the highest point in Wisconsin, is marked
by the bench mark on the short pillar beneath the tower.
The tower is there to allow resurveys of this and other
key bench marks. Such resurveys correct errors on maps,
detect movements of the crust, and detect subtle
variations in the motions of the Earth. |
Contacts
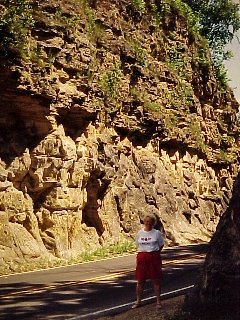 |
Geologists spend much of their time in the field
trying to locate contacts between rock units,
where the relationship between the units can be seen.
This photo shows a contact between Ordovician dolomite in
the top of the cut and Cambrian sandstone at the bottom. What
you don't know won't hurt you - it can kill you. About
1900 the citizens of Mindoro, near LaCrosse, got the idea
of cutting through the ridge to shorten the distance to
the main road by several miles. They thought it would be
easy because the sides of the hill were soft sandstone.
Nobody asked "if the rock is so soft, why is there a
ridge here?" The ridge was capped with hard dolomite.
The cut took two years and was the second-largest
entirely hand-dug excavation in the United States.
|
Geologic Maps
 |
This is the Rolls-Royce of geologic mapping,
published by the Ontario Geological Survey. Outcrops of
rock are shown in a dark shade, concealed areas where a
unit is inferred to exist is done in a light shade. The
user knows exactly what the evidence is and where it is
located. The prominent diagonal color boundary is a major
crustal boundary called the Grenville Front. |
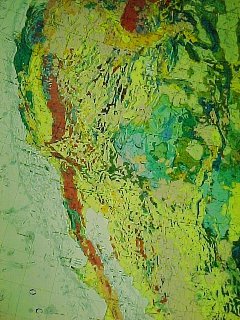 |
Lots of small geological maps are combined into
regional syntheses, like this one of the southwestern U.S.
and part of Mexico. Maps of this sort can look
misleadingly complete; there may be large areas with
sketchy or no geologic map coverage, especially in parts
of Mexico. |
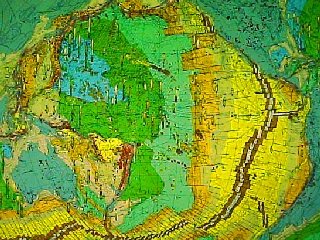
|
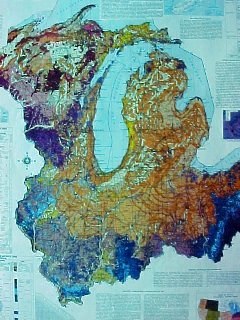
This map shows the geology of the Pacific Ocean floor.
The materials on the sea floor are all pretty much the
same but their age varies systematically, and the colors
show the age of the sea floor. The small columns mark
places where the sea floor has been drilled, and show the
sequence of materials encountered. This map looks
complete but there are areas of thousands of square miles
that have never been investigated by a research vessel. |
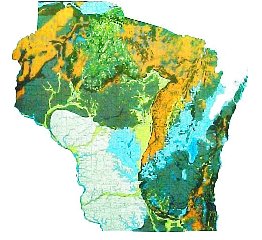 |
This map shows only the materials on the surface in
Wisconsin. Although it outlines the extent of the former
glaciers very clearly, its real purpose is economic. This
map provides clues to sand, gravel and clay resources,
permeability of soil for septic systems, and so on. |
 |
This map attempts to show everything. Where glacial
deposits are thick, they are shown (mostly in brown), and
where thin or absent, the underlying bedrock is shown. |
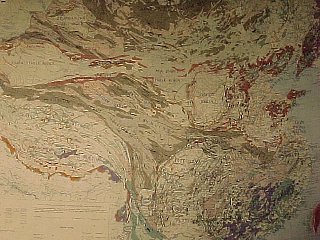 |
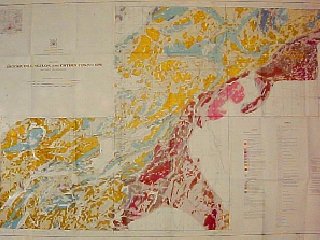
There are many kinds of specialized geologic maps.
This map, called a tectonic map, shows the history
of crustal movements in China and Mongolia. |
|
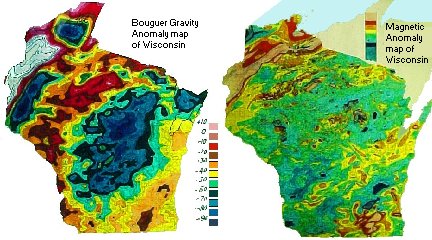
Geophysics is the application of physics to
the investigation of the Earth. These maps show
variations in gravity and magnetism across Wisconsin due
to buried rocks. |
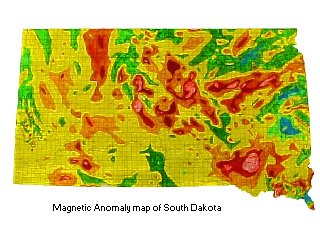 |
The ancient rocks of South Dakota are deeply buried
beneath younger rocks but show up on this magnetic map.
Note the sharp break between NE-trending features on the
east and S- or SE- trending features on the west. This
marks a boundary between ancient rocks over 2500 m.y. old
on the east and 1800 m.y. old rocks on the west.
Occasional samples brought up from deep wells allow us to
relate the magnetic patterns to the actual rocks. |
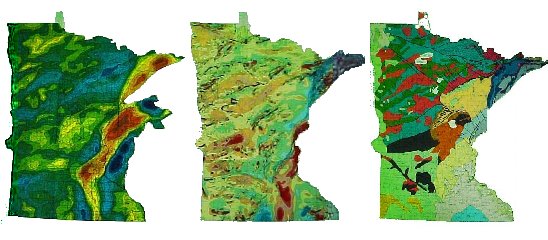
On the left is a gravity map of Minnesota. In the center is a
magnetic map. Note that the patterns are similar (this is a
continuation of the NE-trending patterns on the South Dakota map.)
On the right is a geologic map of Minnesota. Exposures are very
scarce over large areas of northern Minnesota and much of that
area was mapped based on the geophysical maps, rare outcrops, and
occasional samples from wells.
Satellite Mapping
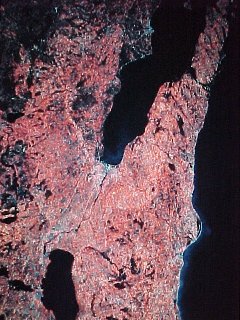 |
Satellite imagery is an important aid to geologic
mapping. This is a Landsat image of the Green Bay area. |
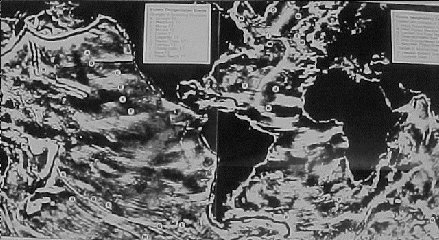
This is a prototype of a revolutionary new kind of map: a map
of the ocean floor made from space. Submerged mountains exert a
slightly higher gravitational pull on the sea surface than
average, and submerged depressions a slightly lower pull. Thus
the sea surface is a subdued negative image of the sea-floor
topography. Radar-mapping satellites can detect this sea-surface
topography and thus map the sea floor. If I hadn't seen it, I
wouldn't have believed it. (This is one of the earliest published
maps of this sort - far more detailed maps have been done since.)
Return to Physical
Geology Notes Index
Return to Professor Dutch's Home Page
Created 13 July 1998, Last Update 28 May 2003
Not an official UW Green Bay site