Flow and transport in fractured bedrock cannot be predicted using traditional hydraulic assumptions. This is due, in part, to a process called channeling that directs flow along certain pathways related to fracture heterogeneities. To observe flow channeling in situ, surface ground-penetrating radar (GPR) was used to detect a saline tracer moving through a sub-horizontal bedrock fracture. The tracer was mapped using amplitude variations resulting from the significant difference in electromagnetic properties between the tracer and natural ground water within the fracture. Results show that hydrogeophysical investigations using GPR can successfully image tracer migration in a variety of flow configurations in three spatial dimensions through time (hence 4D). Tracer travel paths demonstrated meter-scale spatial variability that may be attributed to heterogeneity in fracture aperture.
You will examine data from one of the tracer tests conducted at the site. In this experiment, tracer was injected at a constant concentration and allowed to migrate with the natural ground-water flow (hydraulic gradient).
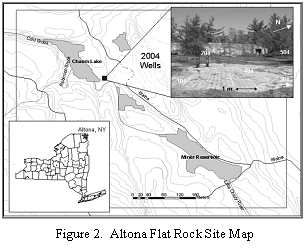
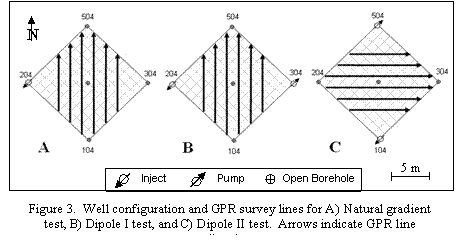
Field experiments were performed near Chasm Lake at the Altona Flat Rock Site, located approximately 15 km northeast of Plattsburgh, New York, USA (Figure 2). Flat Rock is part of a large system of Cambrian Potsdam Sandstone (well-sorted quartzose) pavements that were stripped of overburden during the last glaciation and remain exposed today. There are two orthogonal vertical fracture sets at the site oriented roughly N-S and E-W, as well as laterally extensive sub-horizontal (dipping <3o) bedding plane partitions that are visible in numerous vertical outcrops surrounding the site. Many of the sub-horizontal fractures are laterally extensive and can transmit water over kilometers, providing an effective secondary porosity that is significantly larger than the primary porosity of the rock matrix (<10%, estimated from slug tests). The channeling experiments were conducted in a series of 15-cm-diameter wells arranged in a 5-spot configuration (Figure 3) with 10 meters on a side that each intersect a major sub-horizontal fracture 7.6 meters below ground surface. Results of hydraulic testing indicate that all five wells communicate via this relatively shallow fracture with an approximate transmissivity of 5 m2/day, which suggests a mean aperture of 0.45 mm (Becker and Shaprio, 2003) . The combination of hydraulic connectivity between wells, simplicity of the fracture system, and good GPR conditions (e.g., no overburden and low background electrical conductivity) make this site ideal for tracer-mapping experiments using GPR.


The data are available here. Create a working folder called GPRGeostat in your class working directory. Unzip the data and you will find one shapefile. This shapefile represents the reflection data from the tracer experiment. The reflections were calculated by subtracting background (no tracer) GPR reflection amplitudes from the amplitudes collected 15 minutes after saline tracer injection. Also included in the attribute table is the normalized reflection so that reflection ranges between 0 and 100% of the total range of the amplitudes. The distance units are in meters measured from a local reference point.
You will be asked to contour these data using (1) Inverse Distance Weighting (2) Radial Basis Function and (2) Ordinary Kriging. You need not make formal maps for these contour maps but should use the same color scale on each so that you can compare them. After creating the maps, answer the following questions:
Please turn in your three maps and the answers to these questions as a web page.