Open ArcView with a new project. Save the project in the working directory as geolmap.apr .
Under the Project menu, open the Properties dialog. Specify the working directory you will be using for this project as the "shapefiles" folder that you created. Most data you will produce will be shape files, so this will be the most convenient setting for this project.
Create a new view, and name it Bedrock Map. Add all of the shapefiles
to the view by clicking the ![]() button and then shift+selecting all of the shapefiles. Activate all of the
themes and arrange them such that the point themes overlay the line themes,
and the line themes overlay the polygon themes. You can move the themes
around by clicking and dragging them.
button and then shift+selecting all of the shapefiles. Activate all of the
themes and arrange them such that the point themes overlay the line themes,
and the line themes overlay the polygon themes. You can move the themes
around by clicking and dragging them.
Gliding the cursor over the image, you will notice that in the upper right hand corner of the window the location coordinates are that of latitude and longitude. This is because these shapefiles are as yet unprojected, meaning they are still in geographic coordinates. You will learn about map projections in a later lesson.
You will need to work with the legends to get a resonable display of the themes. Start with the contx.shp theme, which represents all of the bedrock geologic contacts. Activate the theme and use the Properties dialog to change the name of the theme to Bedrock Geology.
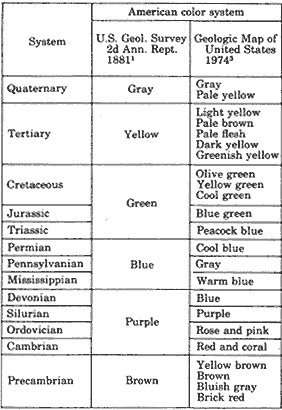
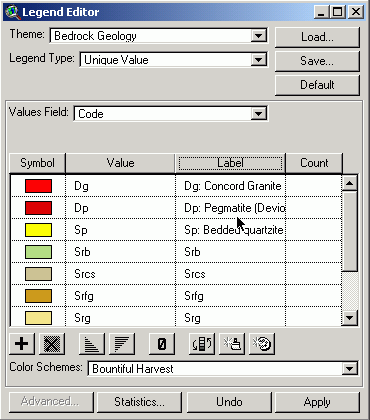
We want to create a color scheme for all of the unique bedrock unit identified in the map. Note that the traditional colors used on geologic maps are are actually set by agreement among the world's geoscientists. In the United States, the U.S. Geological Survey set a color standard for its first national geologic map in 1881. In general, these colors apply only to sedimentary rocks, and plain colors apply only to marine rocks. Sedimentary rocks that form on land are depicted with these colors plus patterns, such as dots or stripes. The other major rock classes—igneous and metamorphic—have their own color traditions. Reds and oranges are reserved for the igneous rocks: volcanics take orange while plutonics take red, and in both of these older rocks are shown with darker colors. Metamorphic rocks tend toward browns, olives, and other "complex" colors. All of them use patterns freely as well. As we are interested in metamorphic rocks here, we will use an olive to brown color scale. Double click on the Bedrock Geology them to open up the legend dialog box. Under Legend Type choose Unique Value and under values field choose Code. The legend should be populated by olives reds and browns corresponding to the various rock units.
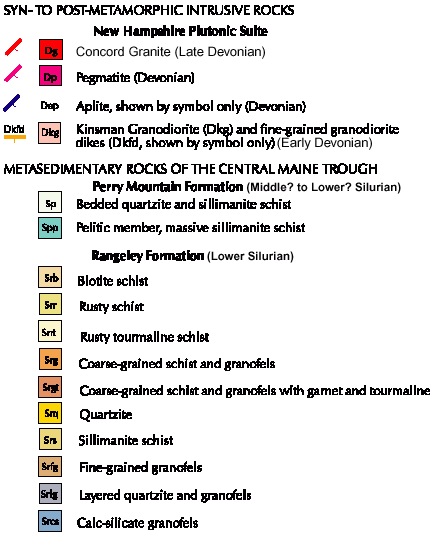
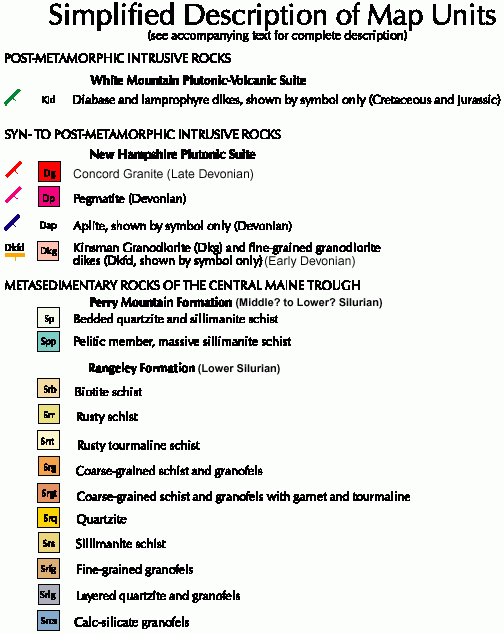
In keeping with the traditional color schemes, we want to change the legend to give plutonic rocks red colors, and make the younger metasediments lighter than the older metasediments. The codes listed in the legend, correspond to those used for the HBEF bedrock map. A close view of the legend from there map provides a description of all of these codes, and the corresponding color schemes. Notice that the devonian intrusive plutonic rocks Dg, Dp, are designated in bright red.
Double click on the theme to open the Legend dialog box, and then double
click on the symbol to open the Marker Palette. Click on the ![]() button and change the colors for Dg and Dp to strong red colors, making
the older rock slightly darker. Repeat this process to make sure that the
younger Silurian rocks are slightly lighter than the older Silurian rocks.
Apply the changes and close the legend dialog box. Save the project.
button and change the colors for Dg and Dp to strong red colors, making
the older rock slightly darker. Repeat this process to make sure that the
younger Silurian rocks are slightly lighter than the older Silurian rocks.
Apply the changes and close the legend dialog box. Save the project.
Give brief descriptions of all the bedrock units by typing text in the Label column. As the color codes themselves are cannot be labeled, label as Abbreviation: Description. Use the descriptions given in the HBEF map. Apply the changes and close the legend dialog box. Save the project.
Give the other themes the names Hydrography, Faults, Roads, and Structure.
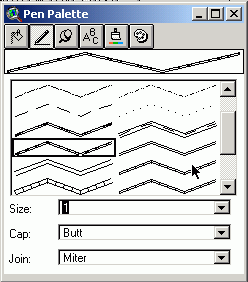
Make the Hydrography cyan. Use the pen palette
to the appropriate double-line symbol for roads with a line thickness of
1, and use the pen palette again to
designate Faults as a solid black line with thickness 2.
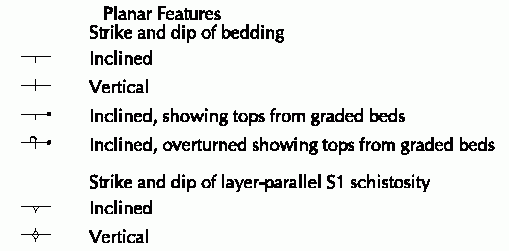
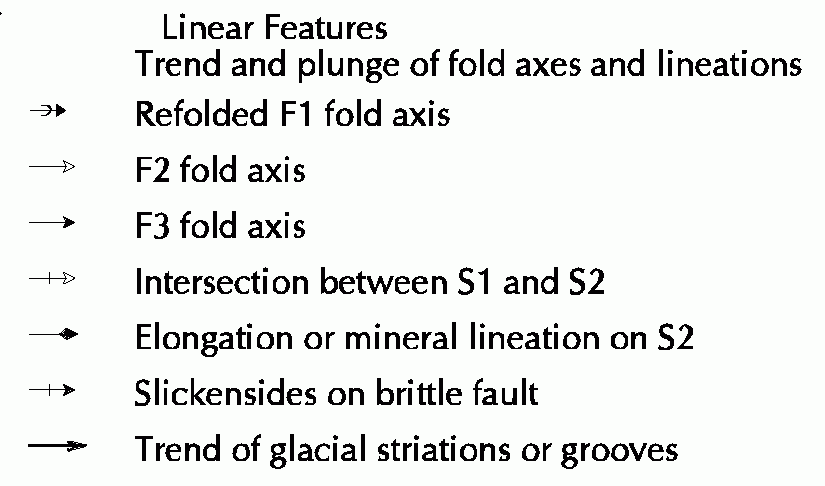
Geologic maps typically have may symbols that represent structural, mineral,
hydrologic, topographic,
and other features. These symbols are being standardized
in digital form by the federal government. On the HBEF Bedrock Map there
are many symbols for various types of structural features. For our map,
we are interested only in differentiating between planar
features which are described by strike and dip, and linear
features which are described only by their trend. We will need to use
special legend symbols to represent these geologic map features. Double
click on Structure to open the legend dialog, and then double click on the
symbol to open the Marker Palette. Click on the fonts ![]() button. Scroll down until you find the ESRI Geology font, select it, change
the font size to 24, and then click on the Create Markers. Now click on
the Markers
button. Scroll down until you find the ESRI Geology font, select it, change
the font size to 24, and then click on the Create Markers. Now click on
the Markers ![]() button and scroll down until you see the geologic symbols you just added
to the marker list. Now close the Marker Palette.
button and scroll down until you see the geologic symbols you just added
to the marker list. Now close the Marker Palette.
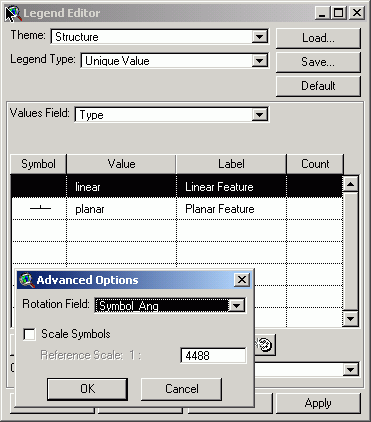
From the Legend dialog box, choose a Legend Type of Unique Value, and from the Values Field chose Type. Different symbols will be assigned to linear and planar features. Change the label of the symbols to Linear Feature, and Planar Feature, respectively.
Double click on the Linear Feature, click on the Markers ![]() button, and scroll down to choose the
button, and scroll down to choose the ![]() symbol.
Change change the font size to 16, the color of the symbol to black. Click
apply and then double click on the symbol for the Planar Feature. Choose
the
symbol.
Change change the font size to 16, the color of the symbol to black. Click
apply and then double click on the symbol for the Planar Feature. Choose
the ![]() symbol
for the Planar Feature, change the font size to 16 and change the color
to black. Click Apply and close the Legend dialog.
symbol
for the Planar Feature, change the font size to 16 and change the color
to black. Click Apply and close the Legend dialog.
Note that the Structure features do not look right, because all of the symbols are oriented the same way. We can vary the orientation of these symbols if we wish. Open the legend dialog for the Structure theme. Highlight the symbol for Linear Feature and click the Advanced button at the bottom. In the dialog that opens, choose Symbol_Ang for the rotation field. Click OK to return to the legend dialog. Repeat the process for the Planar Feature. Click Apply and close the legend dialog box. The symbols should now be oriented according to their strike. Save the project.
The ArcView project is now finished. What remains is to format the geologic map. Geologic maps vary in their content, layout, size, and format. There are some essential features, however, that all maps should have. Before you proceed to format your map take a look at some of the essential map features of the Bedrock Map of Hubbard Brook Experimental Forest. To look at some other geologic maps, you can browse through the images at the USGS Maps on Demand site.