Because the data have been corrected for elevation, latitude, and mass of landforms, the changes in the gravity field are expected to be due to changes in density of the underlying material. The valley fill sediments are less dense than the surrounding bedrock covered by a thin mantle of till, so we would expect that gravity lows would be associated with the valley fill sediments and gravity highs with the bedrock. More specifically, gravity should be inversely related to the depth of valley fill. Because we expect a linear relationship between gravity and depth of valley fill, we should be able to derive depth of sediments if we depth control at two points.
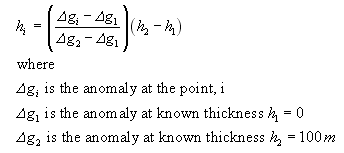
We will use two points where the depth of the surface geology is somewhat constrained. At Station 48, the thickness of the till is almost zero. At the center of the valley at Coal Chutes Road, say at Station 2, seismic data (also by Mark Saunders) indicates a depth to bedrock of approximately 100 m. The difference in the Bouguer gravity at those two points, therefore, could be interpreted to result from 100 m of overburden. We can multiply the Bouguer gravity at all the survey points by 100m/difference in Bouguer Gravity at stations 48 and 2 to get a value of thickness of overburden. The thickness of the overburden (h) is then:
Add another field, h_m, to your table. Use the field calculate to find overburden thickeness at every survey point. Plot the thickness using gradiational color symbols and plot the symbols over the DEM. Does the overburden thickness make sense, assuming that the mantle on the uplands should be much smaller than in the valle? Add a scale, north arrow, and title, and turn this map in.
Finally, produce a map with the same symbolization but overlay it on the surficial geology map. Do you see any correlation between depth and surficial geology? This is a glacially formed valley which underwent some overdeeping during the first glaciation to impact the valley. Add a scale, north arrow, and title, and turn this map in.
<<Last>>