Theoretical Gravity:
The calculation can be accomplished using the field calculator, and the given latitudes for each station. The sine function in field calculator wants radians rather than degrees, so first create a field (under Options...) called Lat_rad (Float, Precision 12, Scale 6) and convert latitude degrees to latitude radians using radians=deg*3.1415926/180.
Create another field called g_t (Float, Precision 12, Scale 6) for the theoretical gravity. Use the field calculator to find theoretical gravity based upon the latitude in radians. Note that the syntax for field calculations can be frustrating, so before you calculate, copy the equation using the "copy" button on your keyboard. That way if it doesn't calculate you can paste it back into the field calculator and start from there. The syntax should be, similar to this, with the use of parentheses to separate terms:
978031.85 *(1 +0.005278895* ( Sin ( [Lat_Rad] ) )^2 +0.000023462 * Sin ( [Lat_Rad] )^4)
As a check, the theoretical gravity for station #2 should be 980373.8 mGal. If it looks OK, make sure you save your edits.
We are now ready to find the Free-Air gravity anomaly using our elevation data. Recall that the free-air anomaly is
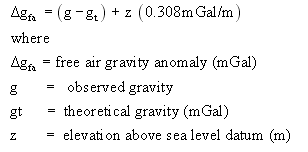
Add a field called "g_fa" to the table (Float, Precision 12, Scale 6). Use the field calculator to calculate the free air gravity, according to the formula given above. Save the edits to your table.
As a check, the Free-Air gravity anomaly for Station #2 should be +9.81 mGal.
The final correction to the data is the Bouguer Correction. The Bouguer Correction accounts for the gravitational mass of above a datum plane, usually sea level. The objective is to remove the amount of mass that would be between the measurement elevation and sea level, such that gravity anomalies are due to DENSITY rather than elevation.
There are different Bouguer corrections applied to gentle topography, rugged topography, and sub-oceanic gravity measurements. Here, we will use the correction for gentle land topography:
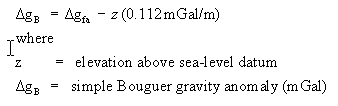
Add a new field to your table "g_b" and use the field calculator to make the Bouguer correction to your data. As a check, the Bouguer anomaly for Station #2 should be -44.06.
Create a map of the Bouguer anomaly data using a scaled symbolization. You should see that the anomaly is higher in the uplands due to the greater density of the bedrock. Add a scale, north arrow, and title, and turn this map in.