In a previous exercise you created a map from scratch, using only a Geotiff image on which you could draw. In the U.S., it is rarely necessary to draw features such as roads, hydrography, etc. These data are freely available. This time you will create the same map, but download your data from a GIS clearinghouse.
Cornell University Supports a site GIS clearing house for New York State Data, called CUGIR (commonly pronounced cougar). CUGIR is the Cornell University Geospatial Information Repository, an on-line library of digital geospatial data and metadata created and maintained by the Albert R. Mann Library at Cornell University. CUGIR distributes spatial data and metadata describing many geographic features of New York State and its subdivisions. CUGIR is an official clearinghouse node of the National Spatial Data Infrastructure (NSDI), and adheres to guidelines and metadata standards set forth by the Federal Geographic Data Committee (FGDC).
In this exercise you want to aquire quad (1:24,000) scale data for the Machias area. Your boundary of interest will again be defined by the "Machias_Boundary.shp" shapefile you used in the previous lesson. The data you will import will consist of hydrography, roads, digital elevation model (DEM), a digital version of the USGS quad map, and a GeoTiff image.
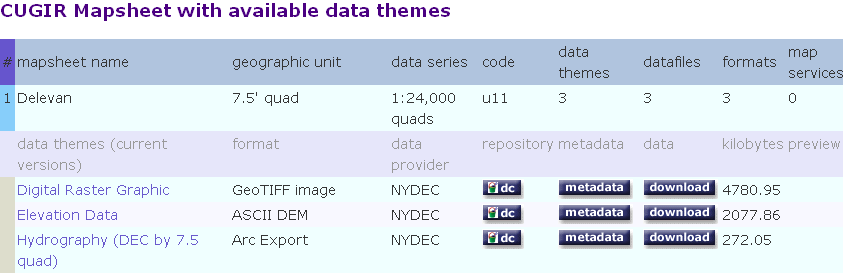
First go to the CUGIR site. At right you can choose to "Select by Map" to get your data. Click on this button and you will see a map of the State. At the top you will see a link for NY Quad Maps. Following this will show a map of all the available quads in the state. It is time consuming to hunt and peck to find your data this way unless you really know your site. Instead, go back to the main page, and this time Select by Name. At the top of the page you should see "Quad Lists". Follow this link and use the menus to select by the the West Valley and Delevan Quads that cover the site.
The search will produce data themes for Digital Raster Graphic, Elevation Data, and Hydrography. Notice that metadata are also available for these datasets. Create a working directory in your class space called MachiasImport. In that directory create another directory called "DelevanQuad" . Withink DelevanQuad create directories DRG, DEM, and HYD for the Digital Raster Graphic, Elevation Data, and Hydrography data, respectively. Download the data into their respective directories ALONG WITH the metadata. Clicking on the Metadata button will allow you to view the metadata. To download, right click on one of the three formats at the top and select Save Link Target as... and save the target to the directory. Make sure you save the metadata in the same directory as the corresponding dataset.
If you browse these directories you will notice that the dataformats are not all that familiar. The DRG is a series of GeoTiff images, the DEM is ascii data, and the hydrography is in "ArcExport" or Interchange form.You can tell from the *.E00 file type. ArcExport is an ESRI standard for storing coverage data.
Repeat this process for the West Valley Quad naming it's directory WValleyQuad.You should now have Digital Raster Graphic, Elevation Data, and Hydrography data for the Delevan and West Valley Quads.
When you are done Open Arc Catalog.
Go to Page 2