We now have all the data we need for our study area, but the problem is that we have more data than we actually need. There is no need to carry around data that is outside of our area of interest, because it just increases our database size and causes raster data to render slowly. Consequently, we will "crop" our data to the area of interest.
The study area boundary was defined in the previous lesson "Machias Map". Use ArcCatalog to copy the shapefile Machias_Boundary.shp from that lesson into the current working directory (above Delevan and WestValley directories). If you deleted the original shapefile when you created the geodatabase, you will need to export the feature class from the geodatabase to a shapefile, and then copy it over to your directory.
We will use this boundary as a "cookie cutter" to remove extraneous data. First lets create a directory to store our clipped data. In your Delevan directory create a new directory called "Clipped". This is where we will gather all t he clipped data from the three different data types.
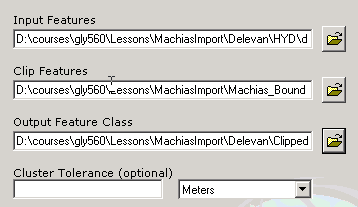
Under the Analysis Tools... Extract... you will see a "clip" tool. If you can't find it, you can always type clip in the index and click on "locate" which will bring you to the tool. Start the tool. Enter the Delevan Hydrography Sha pefile name (delevanhydshp.shp) for the input feature, the Machias_Boundary.shp for the Clip Feature, and name the Output Feature Class "DelevanHydClip.shp" in your Clipped directory. When the tool finishes, preview the result in ArcCatalog. You will see that only the central data were retained, i.e. data within the boundary shape.
Repeat this process for the West Valley Quad Hydro Data
To perform the same task on the DRG and the DEM we will need to use Raster clipping tools. Under Data Management Tools...Raster, you will find a "Clip" tool. This tool allows you to clip down a raster based upon a bounding rectangle which you must define. Because the raster data are defined according to XY data in a particular projection, it is important that you give this rectangle coordinate in the right projection. I your case, you have alread reprojected the DRG into the correct coordinat e system so this won't be a problem.
The rectangle you want is the Machias_Boundary.shp rectangle. The most expedient way to clip the raster so that it matches this boundary is to simply read the bounding coordinates off of the boundary file. Preview Machias_Boundary.shp in ArcCatalog and move the cursor as close as possible to the upper left corner. Write down the X and Y coordinates. Do the same to the lower right corner. You now have the min and max for the X and Y coordinates that you wish to retain in your final raster data.
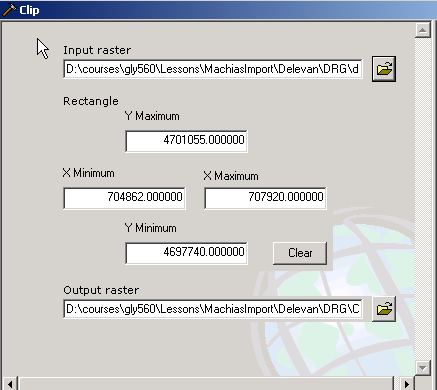
Start the Clip tool and enter the mosaicked DRG in NAD27 coordinates as the Input Raster. Input the rectangle coordinates you found (should be close to those below) and then give the output raster a name (e.g. deledrgclip) in your Clipped directory.. L et the tool do its thing, it should not take long. When you preview the DRG you should see it encompasses only the DRG within the Machias_Boundary rectangle.
There is overlap between the Delevan and West Valley DRG quad map, so you need not repeat this process for West Valley.
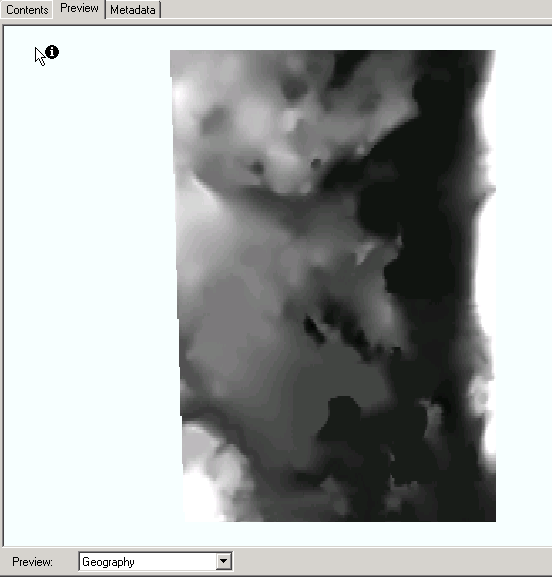
As you recall, the DEM data are simply another raster dataset. It can be clipped in a similar way as the DRG for that reason. Run the clip tool again using the same bounding coordinates that you used for the DRG. Name the output DEM something like del edemclip in the clipped directory and run the tool. When you preview, you should see that only a fraction of the DEM is still present. The lakes are clearly visible as large low flat areas (black) on the dataset. Unfortunately, you will notice that the me tadata have been lost in the clipping. You will need to import the XML metadata once again.
Repeat this process for the West Valley DEM data and import its metadata.
Your data are all organized (for both Delevan and West Valley Quads) and ready for map creation. We could go further and mosaic all the raster data, but we will not mess with that today. Also, you will find there is an artifact in the HYD data, a line running along the seam of the two quads. This should be removed, and can be removed in ArcEdit, but we will not mess with that either.
Before you create the map, import the GeoTiff from your previous MachiasMap exercise into your current working directory.
Start ArcMap.
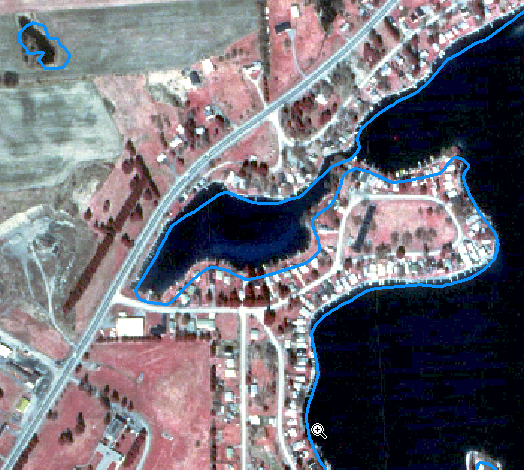
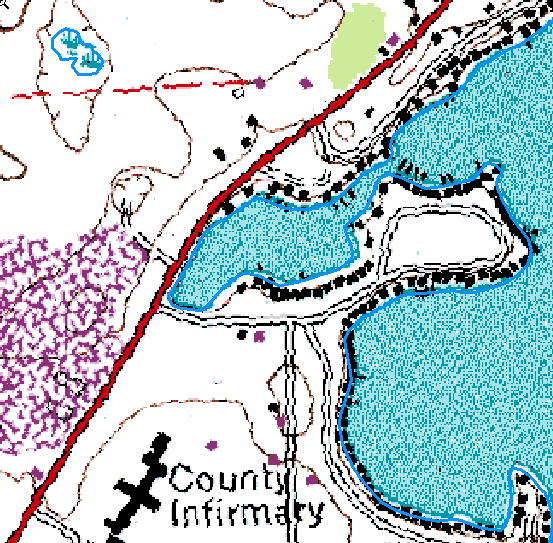
Overlay the new imported data with the old GeoTiff on which you built your previous map. They should overlay almost exactly (see below). You will notice that the hydrography better follows the quad map from which the vector file was derived.
Create a final Vector Map similar to the map you created before for the MachiasMap exercise. Make sure that, this time, you make a note of the projecton coordinate system somewhere on the map.
Publish your final map on the web for credit.
Whew! You're done!