In this exercise you will develop a raster catalog for digital orthoquad data. The study area will again be Machias, so you will need to copy some data from that previous exercise. You will create a personal geodatabase with the prior information that you collected, as well as adding some new digital orthoquad data.
We will obtain the orthoimages from the New York State GIS Clearinghouse this time. Open a Windows XP session. Start Internet Exporer (Firefox is not compatible with the tools we will use). If you have pop-ups disabled you will have to enable them in Explorer. Go to the site: http://www.nysgis.state.ny.us/. Select "Orthoimagry" on the blue menu near the top
![]()
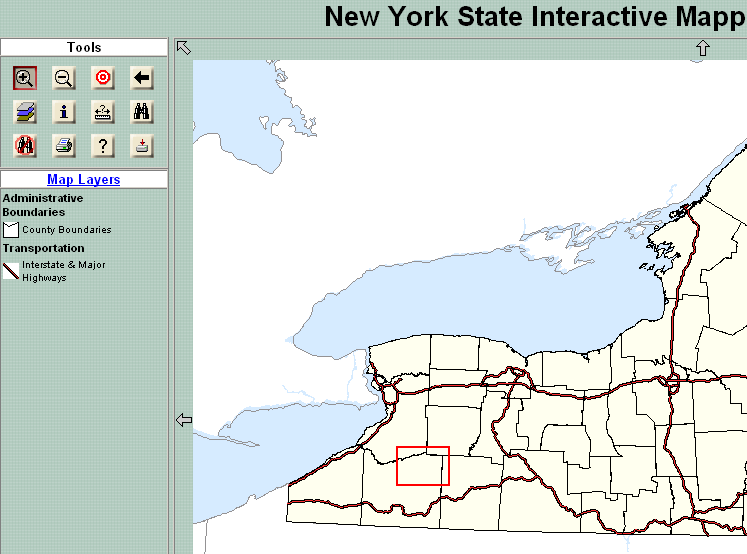
On the next page select the interactive viewer by clicking on the map image. This should open up an interactive server window. Use the zoom tool to focus in on the Machias region.
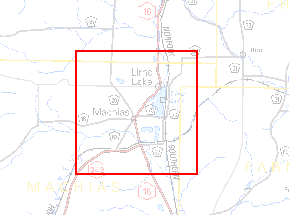
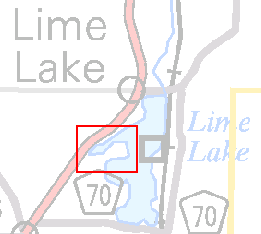
Zoom in further to only the Machias Region, then zoom tightly into the western portion of Lime Lake:
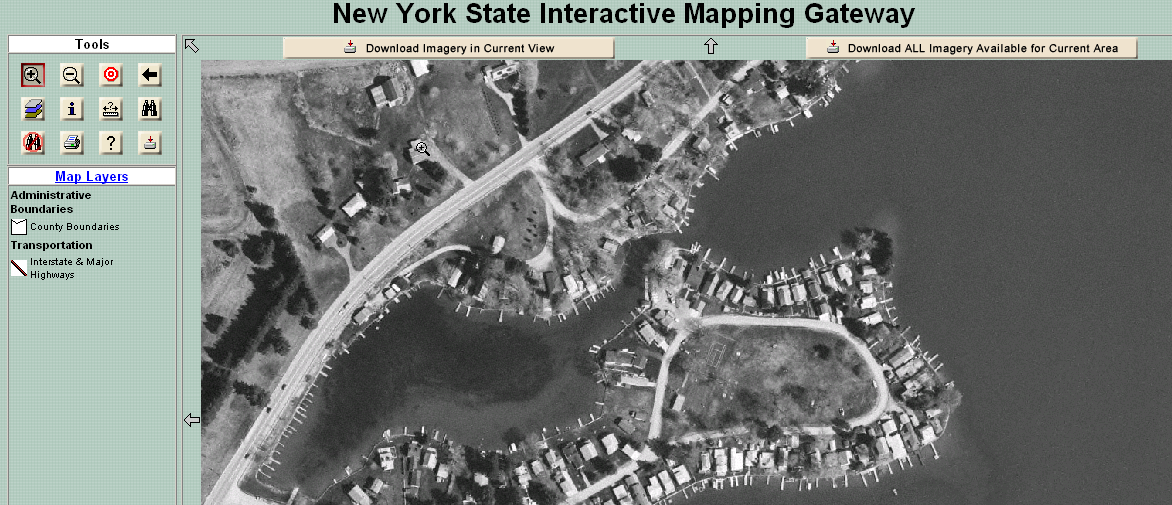
If the map scale is less than 1 mile ![]() , you should see the orthoimages displayed, with two buttons at the top for downloading data:
, you should see the orthoimages displayed, with two buttons at the top for downloading data:
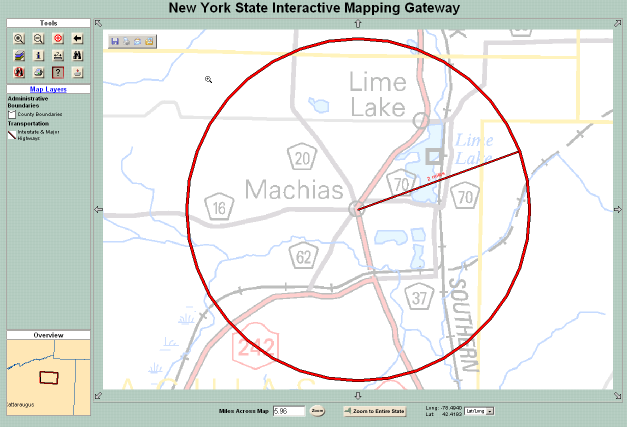
In this window you can browse orthoimage and other GIS data available at the NYS GIS clearinghouse. For this application, we want to download only those data that are relevant to the Machias area. To do this, we will preform a proximity search. "Distance Search from a Point" is a search within a defined distance from a location (point clicked) in the map window. Units of measure are miles or feet. The features that fall within the area defined will displayed within the radius (indicated by a red circle).
Select the "Distance Search from Point", and click the "Submit" button. The user is then prompted with a dialog to define the extent of the circle (radius) as shown below, except search for a radius of 2 miles.
After entering a distance and choosing the "Units" (miles or feet), click the "Search" button. After clicking the "Search" button, click on the desired location in the map window. The point where the user clicks on the map window will serve as the center of the map. A red circle representing the distance from the point clicked is shown.
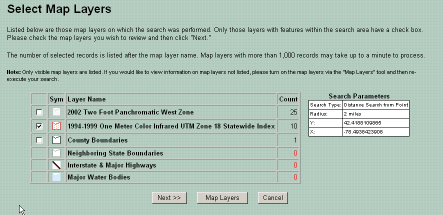
Another browser window is opened to view information associated with map layer features that fall within the radius. The "Select Map Layers" dialog allows the user to select map layers to search. Note that only map layers currently visible in the map window will be searched. If the map layer you want to search is not currently visible, you must first turn the map layer on via the "Add/Remove Map Layer" button. Select the One Meter Color Infrared dataset.
Clicking Next should bring you to a file index of all the DOQQ data that fell within your search area:
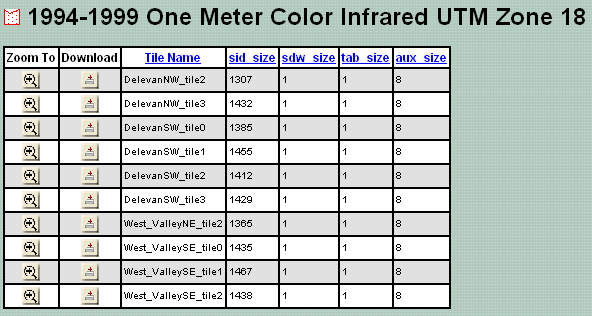
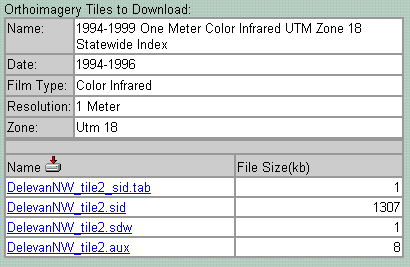
By clicking on the download button for each, you can download these files to your computer. You will see information about each of the datasets when you click on the download link:
By clicking on these files individually you can save them to your computer. Do not do this, because it will be too time consuming and network demanding to do in the lab. For future reference, however, you can access these dame data through direct FTP connection: at ftp://www.nysgis.state.ny.us/pub/napp/ . This way you can download multiple files at once. The region we are working in is listed as F2, so you will find all the Delevan and West Valley quads in that folder.
We should also download the Metadata which are available on the download pages. Unfortunately, these metadata are in .html format which cannot be imported automatically in the ArcCatalog. The metadata can be added manually, but we will not take the time to do this.